Topology
✨ Unlock the Full Potential!
This feature is part of our Enterprise version, offering advanced tools and premium support to elevate your workflow. Get in touch today and discover how we can help you achieve more!
This feature is part of our Enterprise version, offering advanced tools and premium support to elevate your workflow. Get in touch today and discover how we can help you achieve more!
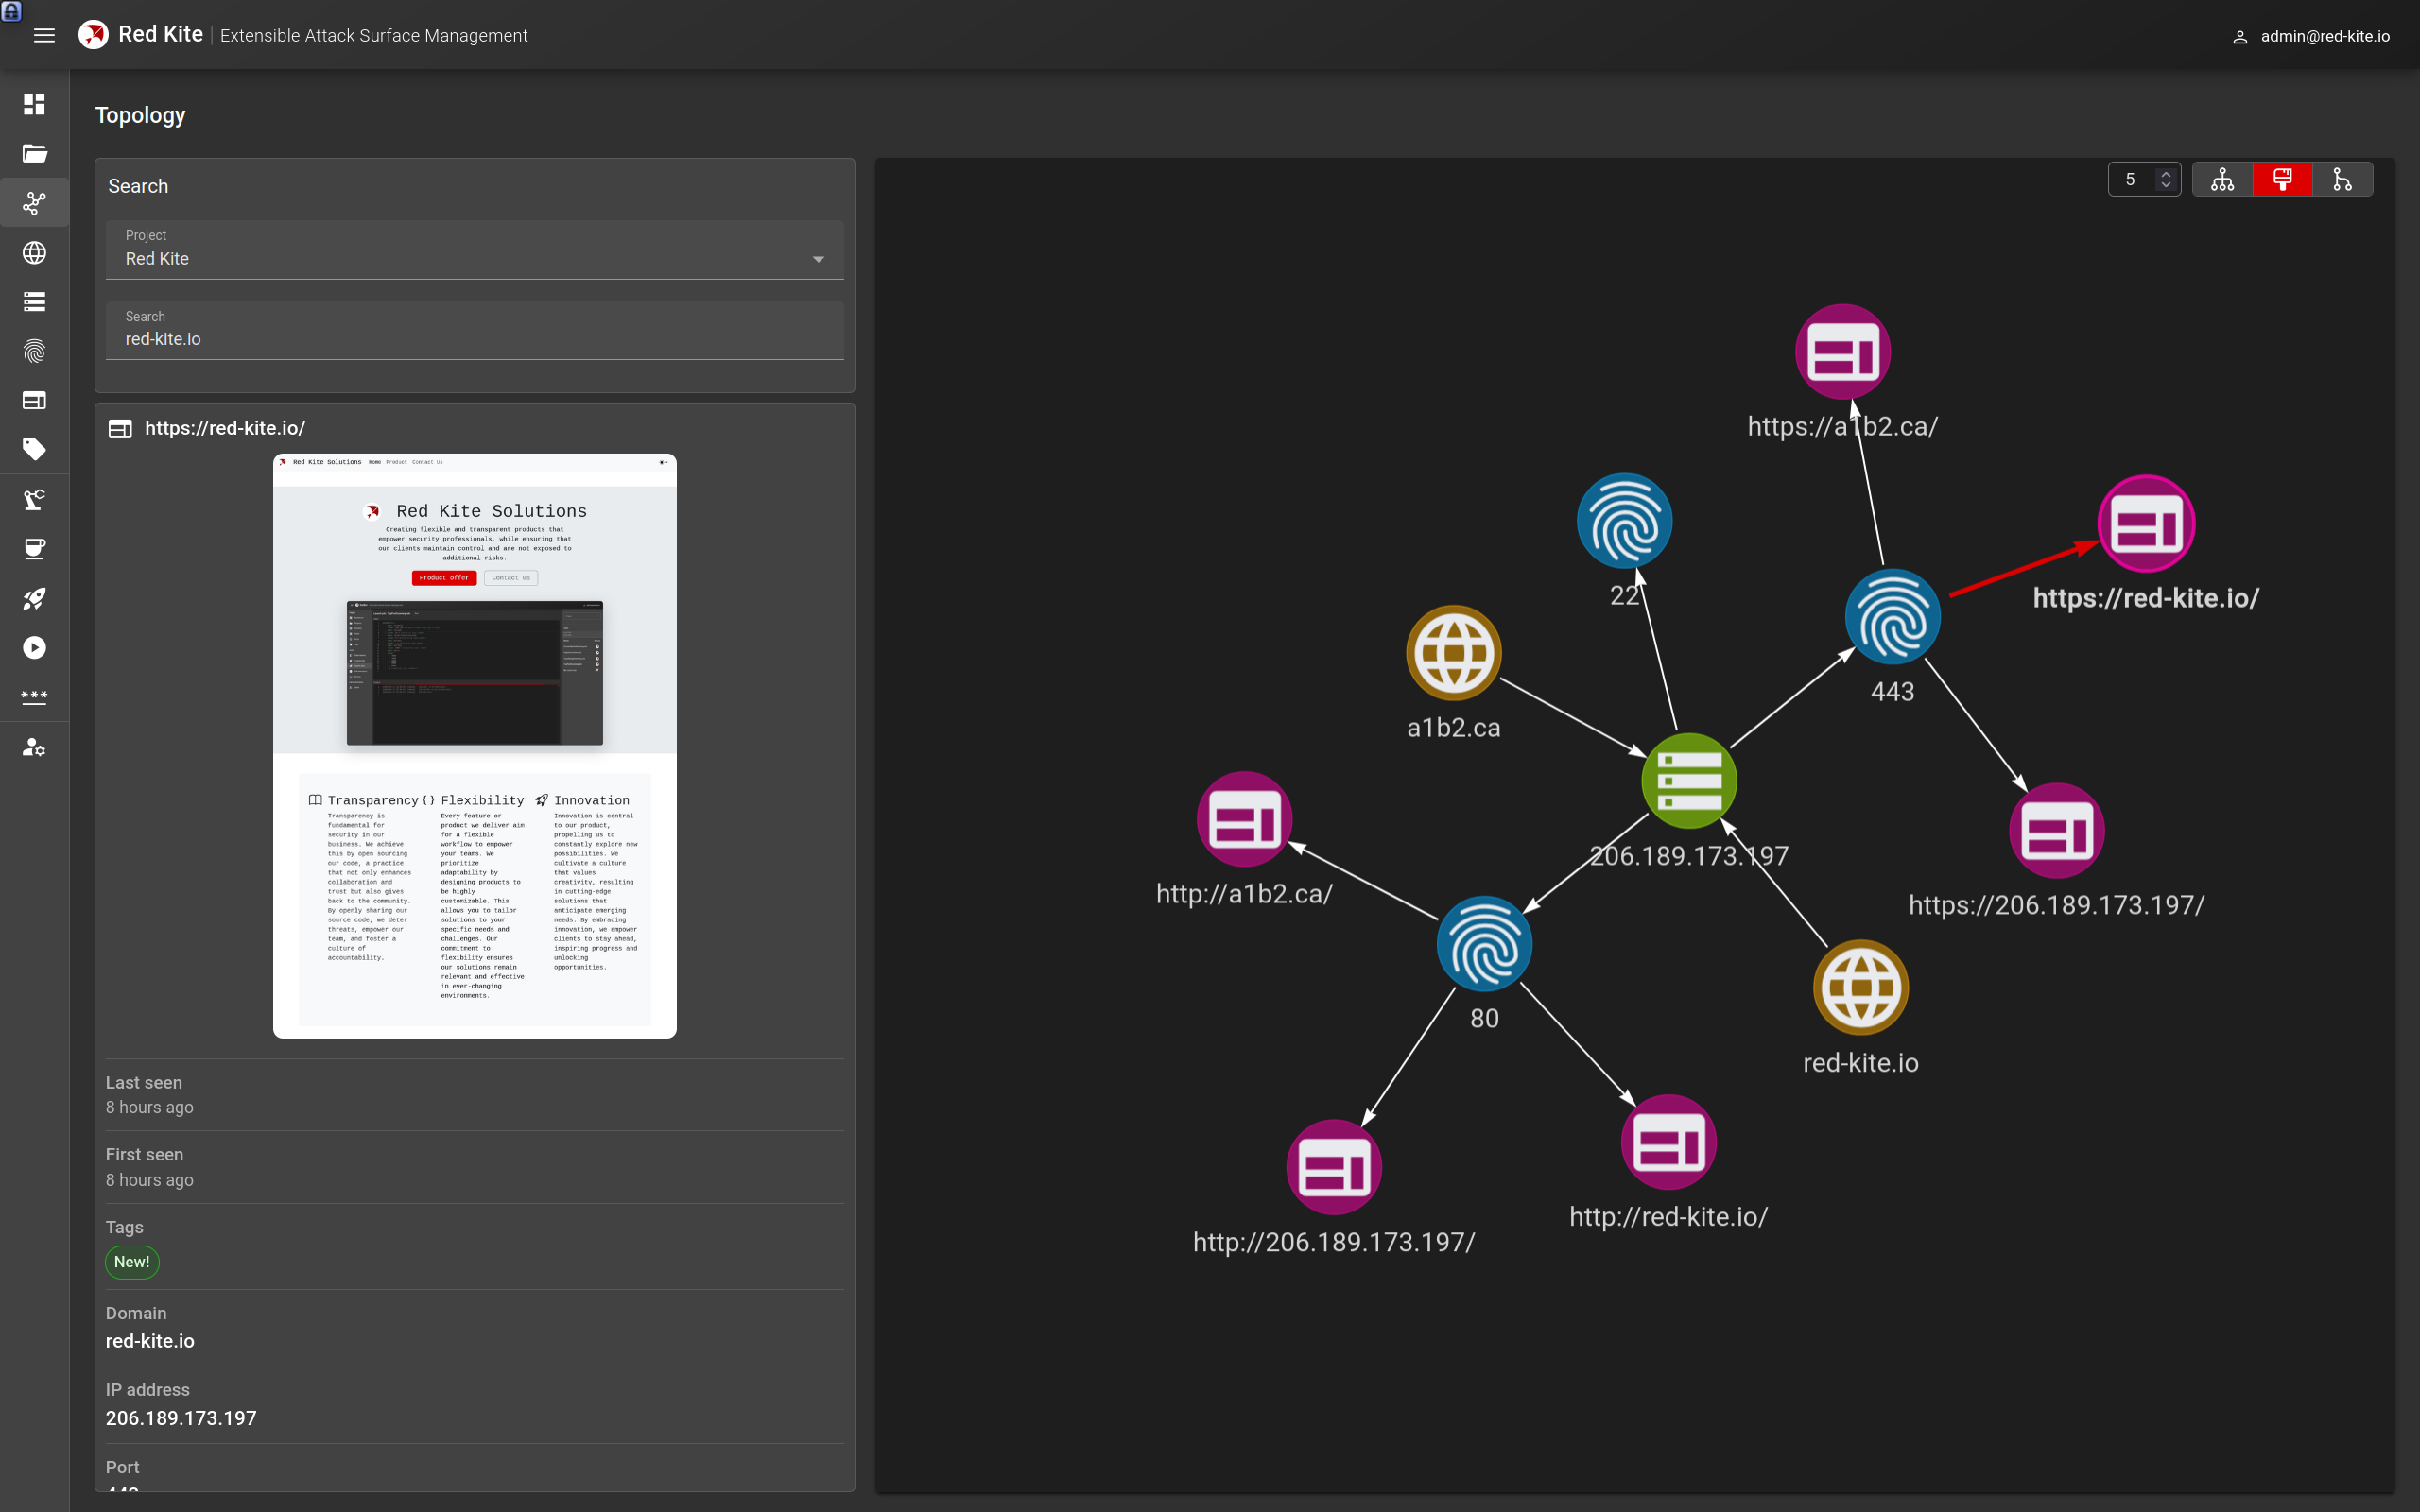
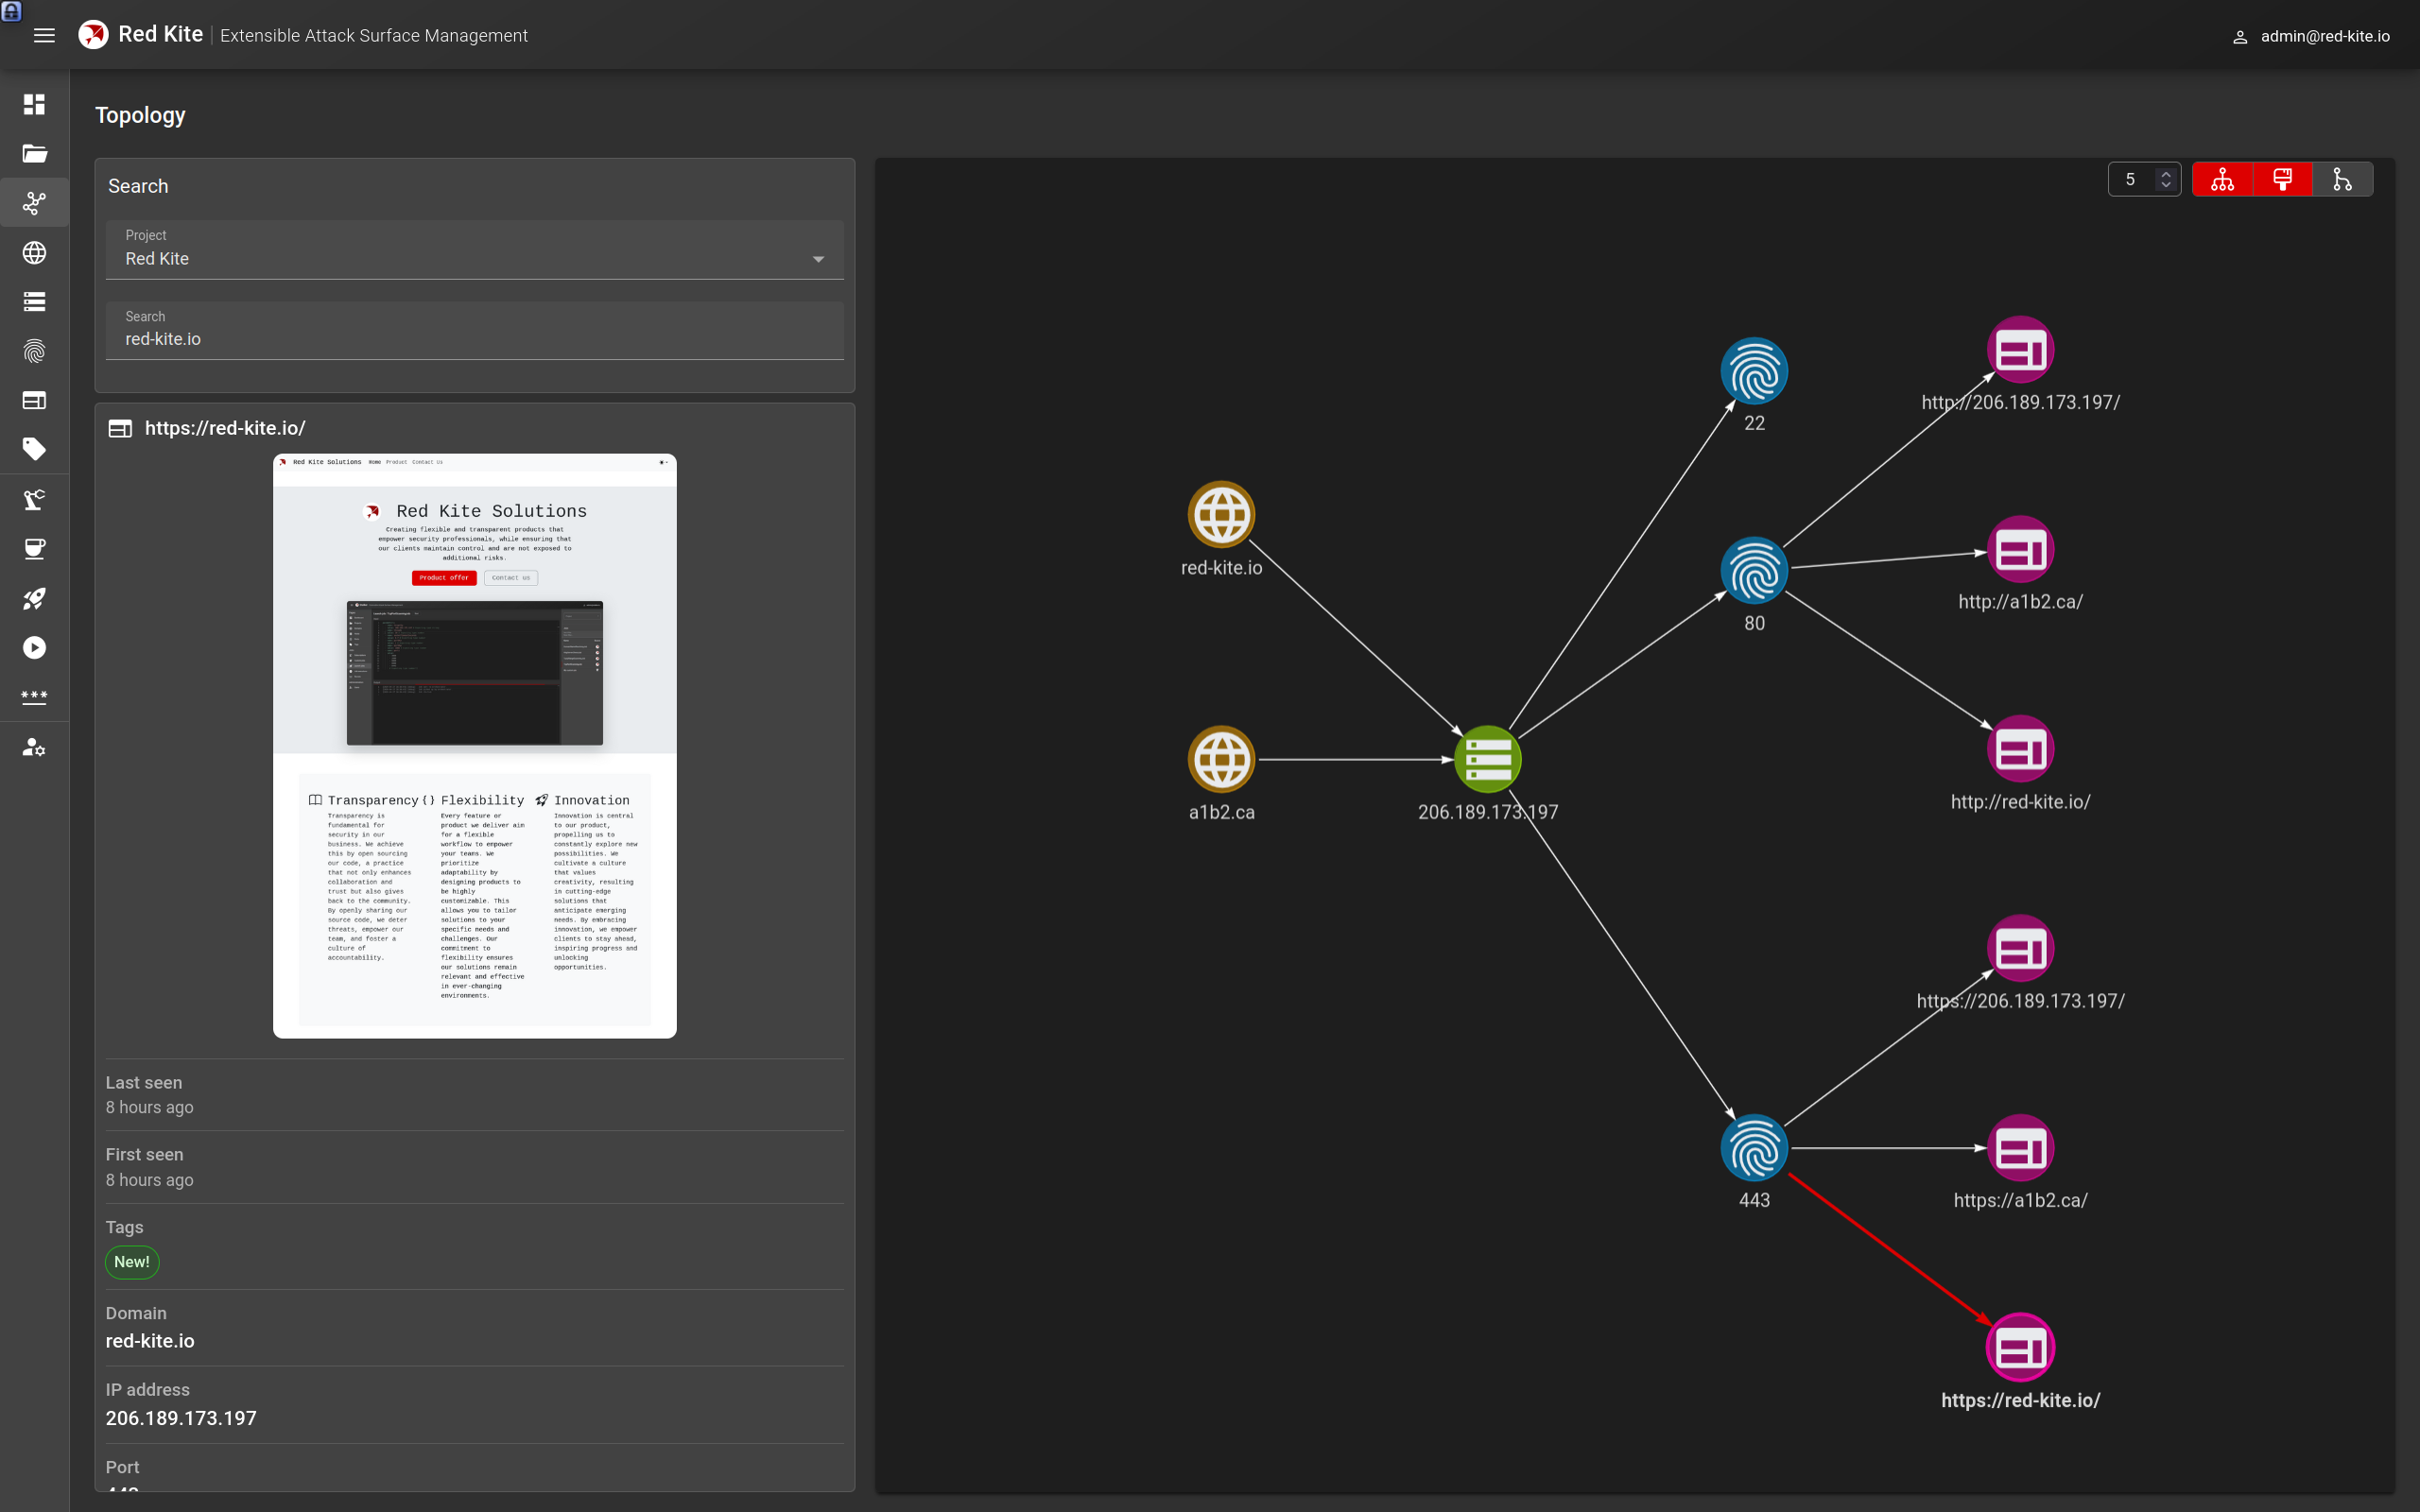
The topology view, or graph view, represents the different resources through a graph. It allows for better data visualization to quickly get the global portrait of an attack surface.
By simply selecting a project, searching a resource and selecting it, you can get a quick overview of its attack surface. Selecting a resource in the graph will also provide you with an preview of its data.
The graphs are by default generated with a depth of 5, but you can specify the depth that you want.

Graphs can also be generated in a tree format

Other options, like removing the colors and curving the lines, are available through the graph buttons at the top.